

The Indian Premier League (IPL) has become one of the most popular T20 cricket competitions in the world, bringing together international stars, emerging players, competitive franchises and millions of cricket fans. From explosive centuries and match-winning bowling spells to unforgettable run chases, every season produces performances that become part of cricket history. Understanding ipl stats helps fans look beyond the final score and discover which players perform consistently, which teams dominate particular situations and how individual performances influence match results.
Whether you follow the competition for entertainment, fantasy cricket research or statistical analysis, IPL records offer valuable insights into the shortest format of the game. Batting averages, strike rates, total runs, wickets, economy rates and team win percentages each tell a different story. This guide explains the most important statistical categories, how to interpret them, where historical records fit into the bigger picture and what to consider when comparing players across different seasons.
What Are IPL Stats and Why Do They Matter?
IPL statistics are numerical records of individual and team performances throughout the tournament. They cover batting, bowling, fielding, match results, partnerships and other measurable aspects of T20 cricket. These numbers allow fans to compare players, identify trends and understand how performances change according to opposition, venue, innings and match conditions.
For example, a batter who scores 400 runs in a season may appear highly successful, but the context matters. Their strike rate, average, number of innings and consistency can reveal whether those runs came through steady accumulation or aggressive scoring. Similarly, a bowler’s wicket tally is useful, but economy rate and average help explain how effectively they restricted opponents.
Reliable statistics are also useful for commentators, journalists, coaches and analysts. They provide evidence for evaluating performances rather than relying entirely on reputation or memorable highlights. However, no single number can explain every aspect of a player’s contribution. The strongest analysis combines several metrics with match context.
Major IPL Batting Records
Batting records are among the most closely followed aspects of the competition. Since T20 cricket rewards aggressive stroke play, batters are often evaluated through total runs, centuries, half-centuries, strike rates and boundary counts. These measures help distinguish players who build innings from those who regularly change a match’s direction within a few overs.
Seasonal records and career records should be considered separately. A player might dominate one edition but have a shorter overall career, while another may accumulate exceptional totals through years of consistent participation. Comparing both categories gives a more balanced picture of achievement.
Important batting statistics
-
Total runs: The number of runs scored by a batter across matches or seasons.
-
Batting average: Runs scored divided by the number of times the batter has been dismissed.
-
Strike rate: Runs scored per 100 balls faced.
-
Centuries and half-centuries: Innings in which a player scores at least 100 or 50 runs, respectively.
-
Boundary count: The number of fours and sixes scored.
-
Highest score: The greatest individual score recorded in an innings.
A batter’s strike rate is especially important in the IPL because teams have only 20 overs to build a competitive total. Nevertheless, an aggressive approach does not always produce the best outcome. A player who scores quickly while losing wickets can place pressure on the rest of the batting order. Effective analysis considers scoring speed alongside dismissals, partnerships and the match situation.
Leading IPL Run Scorers and Historic Batting Performances
Career run totals are useful for measuring longevity and consistency. Virat Kohli has established himself as the leading run-scorer in the IPL, while Rohit Sharma, Shikhar Dhawan and David Warner have also built substantial records across multiple seasons. Their performances demonstrate how different batting styles can succeed in a tournament featuring varied pitches, opponents and match situations.
Single-season achievements can be equally impressive. Kohli’s 973 runs in the 2016 edition remain a landmark individual season, illustrating the impact a batter can have when strong form continues throughout a competition. Meanwhile, Chris Gayle’s extraordinary 175 not out for Royal Challengers Bengaluru against Pune Warriors India in 2013 remains one of the defining individual innings in IPL history.
These milestones highlight two different forms of excellence: accumulating runs over many years and producing a spectacular performance in one match. Both deserve attention when evaluating batting greatness.

Important IPL Bowling Records
Bowling statistics are essential for understanding how teams control high-scoring matches. Although batters often receive attention for boundaries and centuries, bowlers determine how quickly opponents score, when wickets fall and whether a team can defend its total. The most useful measurements include total wickets, bowling average, economy rate, strike rate and best bowling figures.
Yuzvendra Chahal is listed as the leading wicket-taker in the all-time IPL records updated in October 2026, with 233 wickets. Bhuvneshwar Kumar also features prominently among the leading wicket-takers. These achievements reflect sustained performance across seasons, different team environments and changing tactical approaches.
How to interpret bowling figures
-
Wickets: The number of batters dismissed by a bowler.
-
Bowling average: Runs conceded divided by wickets taken. A lower figure is generally better.
-
Economy rate: Runs conceded per over, excluding extras not charged to the bowler where applicable under the scoring rules.
-
Bowling strike rate: Balls bowled per wicket taken.
-
Best bowling figures: The most wickets taken and runs conceded in a single innings.
-
Dot balls: Deliveries from which the batter does not score a run.
A bowler with a low economy rate may be particularly valuable during the middle overs, when restricting scoring can force batters to take greater risks. Another bowler may have a higher economy rate but take crucial wickets during the powerplay or at the death. Match context is therefore important when comparing bowling performances.
Outstanding individual bowling spells
Alzarri Joseph’s 6 wickets for 12 runs for Mumbai Indians against Sunrisers Hyderabad in 2019 is a landmark bowling performance. It demonstrates how one exceptional spell can dramatically change a match.
However, a single outstanding performance does not necessarily establish long-term dominance. Career wickets, averages and economy rates provide a broader picture of consistency. For a complete evaluation, consider the quality of the opposition, the number of matches played and the bowler’s role within the team.
IPL Stats Table: Major Records at a Glance
The following table highlights notable individual and team achievements. These are selected historical records rather than a complete live leaderboard. Career totals and rankings can change as new matches are played.
| Statistical category | Player or team | Recorded achievement |
|---|---|---|
| Most career runs | Virat Kohli | 8,779 runs |
| Most career wickets | Yuzvendra Chahal | 233 wickets |
| Most runs in one season | Virat Kohli, 2016 | 973 runs |
| Highest individual score | Chris Gayle | 175 not out |
| Best bowling figures | Alzarri Joseph | 6/12 |
| Highest team total | Sunrisers Hyderabad | 287/3 |
| Most team wins | Mumbai Indians | 147 wins |
| Highest batting average listed | Sai Sudharsan | 48.37 |
Sources: IPL records archive updated October 3, 2026, and published historical record summaries. Totals and leaderboards may differ between databases because of update timing or statistical definitions.
These figures illustrate the variety of achievements in the competition. Career statistics reward sustained excellence, seasonal records highlight dominance within a particular edition, and match records celebrate exceptional performances. When using a record table for analysis, always check the season covered, the date of the update and whether the figures refer to league matches, playoffs or another competition format.
Team Performance Statistics and Franchise Records
Team statistics reveal patterns that individual records cannot explain. A franchise’s total wins, losses, titles, playoff appearances, aggregate runs and wickets help illustrate its historical performance. These numbers also allow fans to compare established teams with newer franchises without focusing exclusively on individual stars.
Mumbai Indians and Chennai Super Kings have historically been among the most successful franchises in terms of titles and sustained competitiveness. Mumbai Indians also appear at the top of the historical team win totals in the IPL records archive consulted for this article.
Nevertheless, the number of wins alone does not provide a complete ranking. Teams have played different numbers of matches, and their results can be influenced by squad changes, injuries, home conditions and tournament formats. Win percentage, playoff conversion rate and performance in knockout matches can add useful context.
Team metrics worth following
-
Win percentage: Wins divided by matches played, with ties and no-results handled consistently.
-
Highest and lowest totals: Indicate the extremes of a team’s batting performance.
-
Net run rate: Measures scoring rate relative to the opposition’s scoring rate across qualifying matches.
-
Chase success: Shows how effectively a team reaches a target.
-
Powerplay performance: Tracks scoring and wickets during the first six overs.
-
Death-over performance: Examines scoring and wicket-taking in the closing overs.
These metrics can reveal why two teams with similar win totals may have very different strengths. One side may rely on a powerful batting lineup, while another consistently wins through disciplined bowling and effective run chases.
How to Read IPL Player Statistics Correctly
Understanding a statistical record requires more than checking whether a number is high or low. Different metrics measure different skills, and comparing players without accounting for their roles can lead to misleading conclusions.
For example, an opening batter usually faces more deliveries than a specialist finisher entering in the final overs. A lower-order batter might have fewer career runs but a much higher strike rate. Similarly, a fast bowler used primarily during the death overs may concede more runs while attempting to take wickets against aggressive batters.
When analysing IPL statistics, consider these factors:
-
Matches and innings played: Career totals should be assessed alongside opportunities.
-
Player role: Compare openers with other top-order batters and finishers with players in similar positions.
-
Season conditions: Pitch behaviour, ground dimensions and weather can influence scoring.
-
Opposition quality: Performances against strong bowling attacks may carry additional analytical significance.
-
Recent form: Career averages may not reflect a player’s current performance level.
Using several indicators together produces a more balanced assessment than relying on one headline figure.
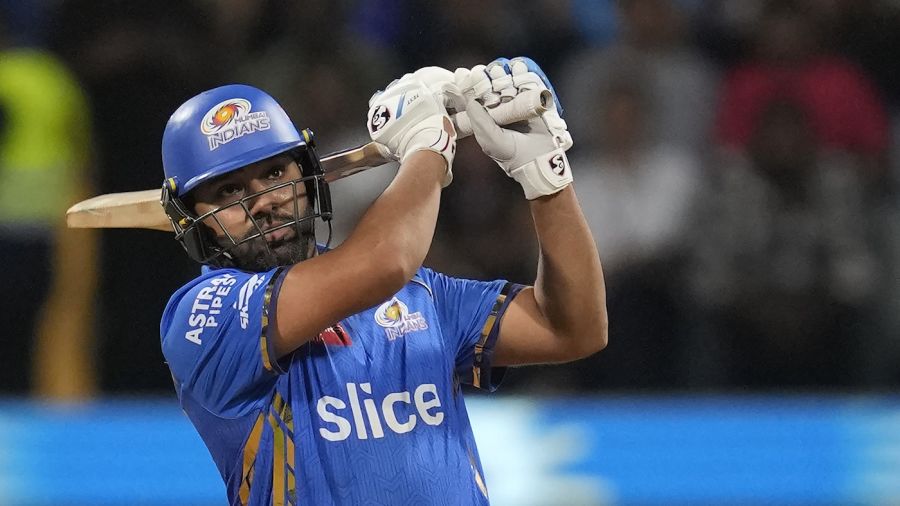
Seasonal Statistics and the Orange and Purple Caps
Season-by-season statistics help fans follow the changing shape of the competition. The Orange Cap recognises the leading run-scorer in an IPL season, while the Purple Cap recognises the leading wicket-taker. These awards provide a straightforward way to identify the standout performers in the two main disciplines.
Seasonal leaderboards are particularly useful because they compare players within a broadly shared tournament environment. They can show whether a batter is building consistent innings, whether a bowler is taking wickets regularly and how emerging players are competing with established international stars.
However, the final standings can change rapidly. A player who leads the run charts midway through a season may be overtaken after a few matches, while a bowler can climb the wicket rankings with a single exceptional performance. For this reason, fans looking for current standings should check an updated season leaderboard rather than rely on an older article.
Where to Find Reliable IPL Statistics
Accurate data is essential for meaningful comparisons. Different cricket databases may update at different times, so it is worth checking the date and scope of the information before quoting a record.
Useful resources include official tournament statistics, individual scorecards, season archives and established cricket databases. When researching a specific player, review their batting and bowling figures together with their match history. For team comparisons, check both historical records and the latest completed season.
A reliable statistical source should ideally provide:
-
Career and season-by-season records.
-
Individual match scorecards.
-
Batting averages and strike rates.
-
Bowling averages, economy rates and wickets.
-
Team standings and match results.
-
A clear update date and consistent definitions.
For publishers, analysts and cricket enthusiasts, checking these details reduces the risk of repeating outdated totals or mixing figures from different formats.
Frequently Asked Questions
1. What do IPL stats include?
They include batting runs, averages, strike rates, centuries, sixes, bowling wickets, economy rates, fielding records, team totals, match results and seasonal standings.
2. Who has scored the most runs in IPL history?
Virat Kohli is listed as the all-time leading run-scorer in the IPL records archive updated on October 3, 2026. His career total is updated as additional matches are played.
3. Who has taken the most wickets in IPL history?
Yuzvendra Chahal leads the cited all-time wicket-taking leaderboard, with 233 wickets in the records archive consulted for this article.
4. What is the difference between batting average and strike rate?
Batting average measures runs scored per dismissal, while strike rate measures runs scored per 100 balls faced. Average indicates scoring productivity across dismissals, whereas strike rate indicates scoring speed.
5. Why do IPL statistics change after every season?
New matches add runs, wickets, appearances, partnerships and team results to historical totals. Rankings can therefore change as active players continue their careers and new players establish records.
Conclusion
The IPL offers an extraordinary range of individual achievements and team milestones. From career run totals and spectacular centuries to wicket-taking records, economical bowling and memorable team performances, statistics help explain why certain players and franchises stand out across seasons.
The most useful ipl stats are those interpreted with context. Career totals show longevity, averages and strike rates reveal different aspects of performance, and team records illustrate how individual contributions translate into results. By combining these measurements and checking updated records, cricket fans can develop a deeper understanding of the competition and appreciate performances beyond the final scorecard.

